Real Estate Business Plan for 2027: Work Backward From Last Year
Start a 2027 real estate business plan with last year’s numbers, not a wish. Pull five figures from Follow Up Boss: leads, appointments, closings, lost deals and average commission per closing. Divide your income goal back through those ratios to get a weekly target, then write each weekly target as a specific when-and-where plan.

An agent who made 3,252 calls for 44 closings last year needs about 3,900 calls to close 53 next year.
That’s the worked example Follow Up Boss published from Chelly Herren’s planning process (“Set real estate goals you can crush,” January 2024). Herren, COO of The Hyland Group at eXp, sets each agent’s goals from their own prior-year reports. The illustration’s numbers are hypothetical, but the move is the point: last year’s calls per closing (the article rounds it to about 73) times next year’s closings. It ends at “16 calls per day, Monday through Friday,” which is a sentence an agent can actually do on a Tuesday.
The method is simple. Where it goes wrong is the data underneath, and that’s most of this guide.
Why last year beats a target you picked
People are bad at predicting their own future work. In a set of studies published in 1994, Roger Buehler and colleagues found that people’s predictions of when they’d finish their own tasks were consistently too optimistic, and that they built those predictions around how they planned things to go rather than how similar tasks had gone before. In one of the studies, the optimistic bias went away when participants were told to connect relevant past experiences to their predictions (Buehler, Griffin & Ross, Journal of Personality and Social Psychology).
That’s the argument for planning from Follow Up Boss. It’s a record of how last year actually went: who raised a hand, who you met, who closed. A plan built from the income you want starts from the best-case story instead.
The five numbers to pull from Follow Up Boss
Use the same twelve months for every number. Calendar 2025 is cleanest if you’re planning now, or the last twelve full months if your business is seasonal in an odd way. All of these live under Reporting, and Follow Up Boss lets you export the main reports to a spreadsheet.
| Number | Where to find it | What to watch for |
|---|---|---|
| Leads you took on | Agent Activity report (new and initially assigned leads) | Lenders, vendors and other agents counted as leads |
| Appointments met | Appointment report | Appointments set but never marked as met or cancelled |
| Closings | Deals report, closed deals in the window | Closings that never got a deal record |
| Lost deals | Deals report, deals in a lost stage or archived | Dead deals left open in an active stage |
| Average commission per closing | Deals report, Agent Commission column | Blank commission fields on closed deals |
The Deals report shows deals closed year-to-date, commissions and splits, and the contact and marketing lead source for each deal (Follow Up Boss Help Center: Deals Report). If you plan by source as well, our guide to lead source ROI covers why closings per source matter more than leads per source.
Two close rates, and the one that belongs in your plan
“What’s your close rate?” has two honest answers, and they can be thirty times apart.
- Lead to closed: closings divided by all the leads you took on. This one has every unanswered web inquiry in the denominator.
- Deal win rate: won deals divided by decided deals (won plus lost). This one only counts people who got far enough to become a deal.

Here is how far apart they get. These counts are invented for the example; the arithmetic is not. Say last year you took on 480 leads, met 40 of them at appointments, and ended with 12 closed deals and 4 lost ones.
- Lead to closed: 12 ÷ 480 = 2.5%
- Deal win rate: 12 ÷ 16 = 75%
Plug the 75% into a backward plan as if it were your lead conversion, and 16 closings “needs” about 21 leads. The real answer from the same year is 640. Nobody makes that mistake on purpose. It happens when a coach, a report or a teammate says “close rate” without saying what it was divided by.
For a business plan, use the stage-to-stage ratios: leads per appointment, then appointments per closing. Keep the deal win rate for a different question, which is how well you hold deals together once they exist.
Work it backward: a worked example
Same invented year as above, now with an income goal of $120,000 in commission to you and an average of $7,500 per closing from your Deals report.
| Step | Math | Result |
|---|---|---|
| Closings needed | $120,000 ÷ $7,500 | 16 closings |
| Appointments per closing (last year) | 40 ÷ 12 | 3.33 |
| Appointments needed | 16 × 3.33 | about 53 |
| Leads per appointment (last year) | 480 ÷ 40 | 12 |
| Leads needed | 53.3 × 12 | about 640 |
| Per week, over 48 working weeks | 640 ÷ 48 and 53 ÷ 48 | about 13 leads and 1 appointment a week |

Then sanity-check the size of the goal. In the 2026 NAR Member Profile, the typical Realtor completed nine transaction sides in 2025 and median gross income was $59,200 (NAR, “The Feature Sheet: 2026 Member Profile”). Sixteen closings is well above typical. That’s fine if last year was twelve. It’s a warning sign if last year was five. (Transaction sides and closings aren’t quite the same count, since a deal where you represent both sides is two sides.)
Check the records before you trust a ratio
Every ratio above is only as good as the records under it. Run this audit first.
- Find closings with no deal record. Compare your closing statements or your broker’s production report with the Deals report. A missing closing makes your ratios look worse than they were.
- Close out dead deals. A deal that fell apart in March but still sits in “Under Contract” never counts as lost, so your win rate is wrong too.
- Pull non-prospects out of the lead count. Lenders, title reps, vendors and recruiters sitting in your database inflate “leads per appointment.” Our guide to separating them in Follow Up Boss has five passes for this, and the broader CRM data cleanup checklist covers duplicates and stale stages.
- Make sure appointments were marked. If you set appointments in Follow Up Boss but rarely recorded whether they happened, your appointment count is a guess. The same-day appointment debrief fixes this going forward.
- Fill in commission on closed deals. One blank Agent Commission field drags the average down and quietly inflates the number of closings you think you need.
The limit no audit fixes
Small numbers move a lot. With 12 closings, one deal is about 8% of your year. One more closing makes your appointments-per-closing ratio 3.08; one fewer makes it 3.64. Both are honest readings of a year that could have gone either way. Plan on the less flattering one, or average two years if you have them.
And last year isn’t next year. Rates, inventory or a new lead source can all move the ratios. History is just a better starting guess than optimism, and you’ll see within a few weeks whether it’s holding.
Turn the weekly number into a plan you’ll actually do
“Thirteen leads and one appointment a week” is still a goal, not a plan. The research on what closes that gap is unusually strong. A meta-analysis of 94 independent tests by Peter Gollwitzer and Paschal Sheeran found that if-then plans, which spell out when, where and how you’ll act, had a positive effect of medium-to-large size on goal attainment (Gollwitzer & Sheeran, 2006, Advances in Experimental Social Psychology).
Write each weekly target in that shape. A few to adapt:
If it’s Monday at 9:00, then I open my new-leads Smart List and call everyone added since Friday before I check email.
If an appointment ends, then I mark the outcome in Follow Up Boss before I start the car.
If it’s Thursday at 4:00, then I compare this week’s appointments with my weekly number and book the gap from my past-client list.
Break the bigger pieces down too. Researchers Justin Kruger and Matt Evans found that people who “unpacked” a many-step task into its parts gave longer, and in some experiments less biased, estimates of how long it would take (Kruger & Evans, 2004, Journal of Experimental Social Psychology). “Host four open houses this spring” becomes picking listings, getting seller permission, sign-in setup and the follow-up calls, each with its own week on the calendar.
Then put the numbers somewhere you’ll see them. Follow Up Boss has an Agent Goals report under Reporting, where goals can be set per agent and tracked alongside closed deals and other activity. For the weekly view, our KPI checklist for Follow Up Boss lists what to review each week, and pipeline forecasting with FUB reports covers the pending side. If you’re on a capped split, plan around your cap year as well; commission cap tracking explains why the deal that crosses the cap is the one that breaks spreadsheets.
Where Ace fits, and where it doesn’t
Ace doesn’t write your business plan, and its scores don’t forecast your year. It helps keep the plan’s inputs honest while the year runs.
- Two close rates, named apart. The Pipeline view in Ace Trove shows Lead → Closed % and Deal win rate as separate tiles, each with its own definition, and never a bare “close rate.” Lead → Closed % is measured over past leads rather than your calendar year, so it won’t match your hand count exactly. The same view counts leads that have sat in a stage past its threshold, which is the stale-stage problem from the audit above.
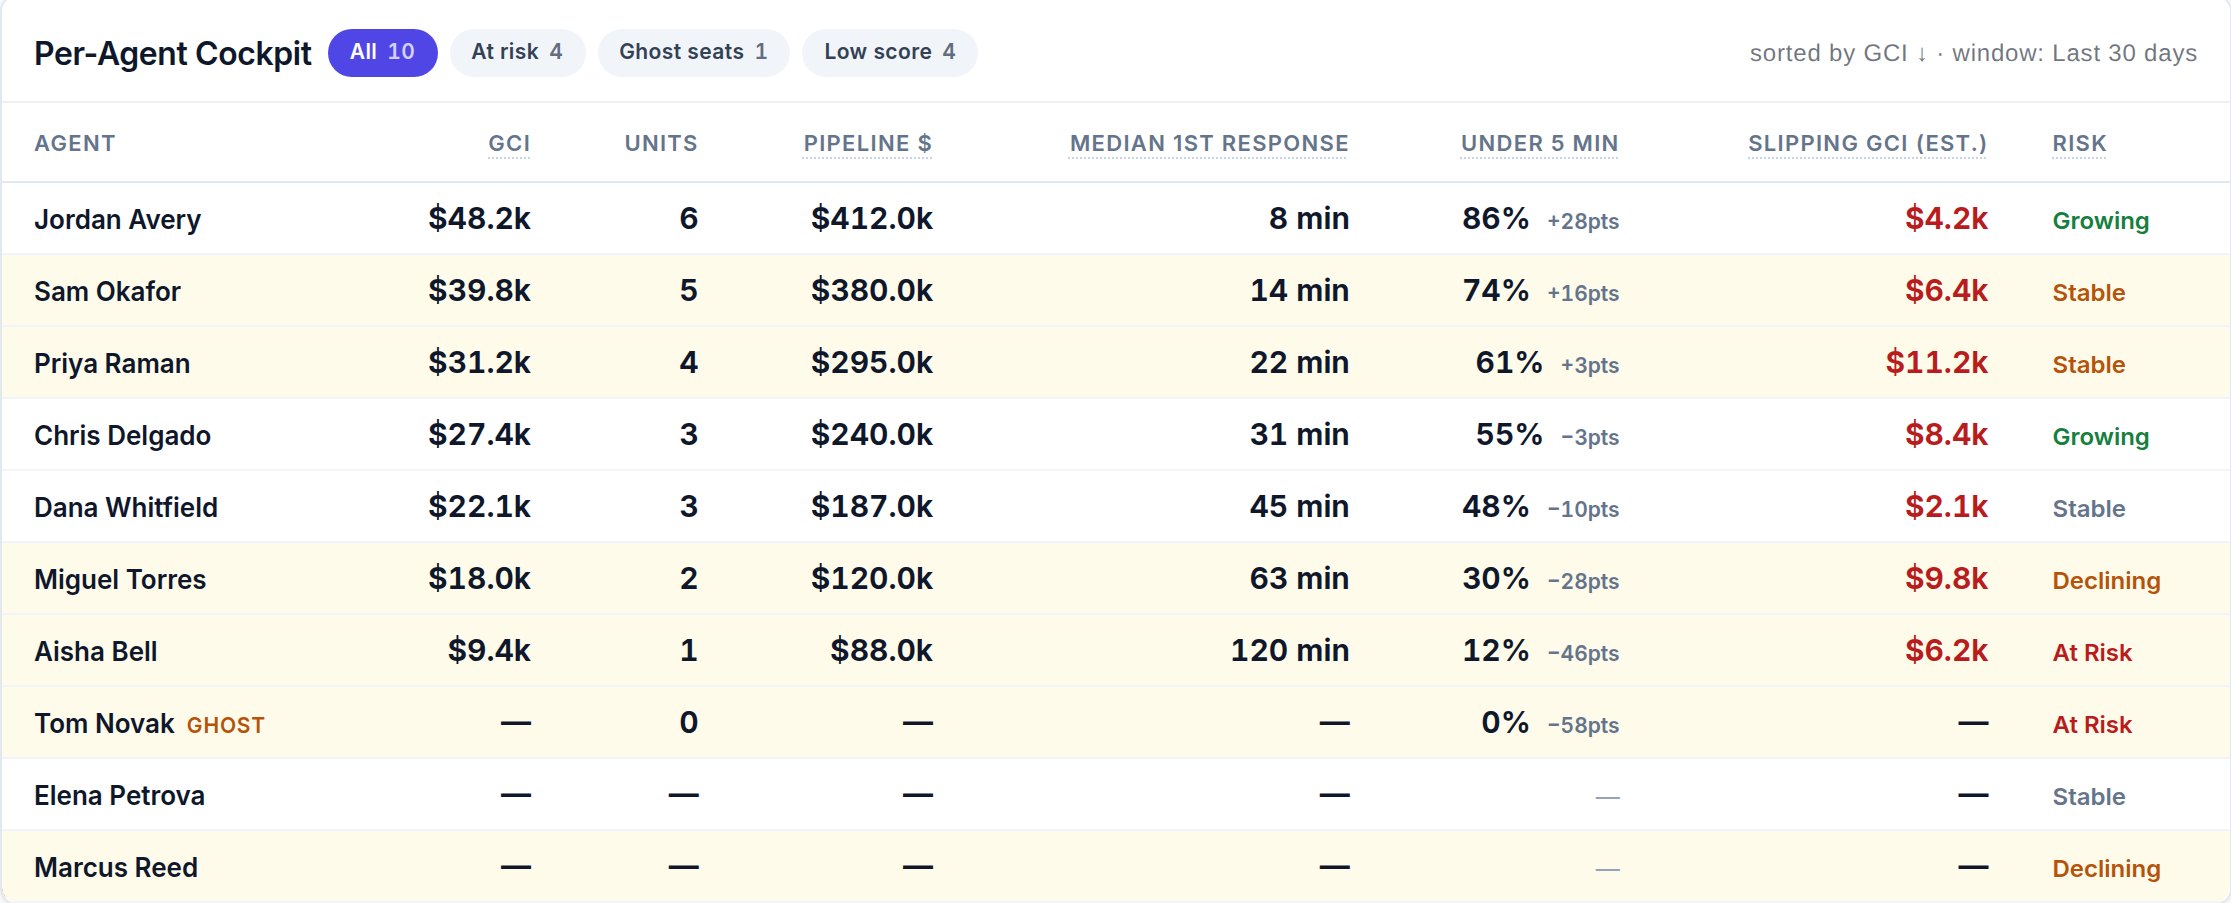
- A monthly check for team leads. Trove’s Team Cockpit puts each agent’s GCI, units, pipeline and median first response side by side for the last 7, 30 or 90 days. It doesn’t show a full year; the Follow Up Boss Deals report is still where you plan from.
- Who to call first. Ace Win Score is free on every account and ranks contacts by who to work first, and several of the free Ace Smart Lists use it to build lists inside Follow Up Boss. It helps with the Monday-at-9:00 list. It won’t tell you how many leads you need.
Frequently asked questions
How many transactions does a typical real estate agent close in a year?
NAR’s 2026 Member Profile says the typical Realtor completed nine transaction sides in 2025, with median gross income of $59,200. A deal where you represent both buyer and seller counts as two sides.
What is the difference between lead-to-close rate and deal win rate?
Lead-to-close divides closings by every lead you took on. Deal win rate divides won deals by decided deals, won plus lost. For a business plan, use stage ratios like leads per appointment and appointments per closing.
Where do I set goals in Follow Up Boss?
Follow Up Boss has an Agent Goals report under Reporting, where goals can be set per agent and tracked alongside closed deals and other activity. Weekly activity targets work best written as specific when-and-where plans.
What if I only closed a few deals last year?
Small counts make ratios jumpy, since one deal changes them a lot. Plan on the less flattering version of each ratio, average two years if you can, and recheck after the first quarter.
See the Pipeline view
Ace Trove adds the Pipeline view, Team Cockpit and the rest of the account-wide layer above Follow Up Boss. Here’s what it includes.
See what Ace Trove includes