Pipeline Analytics 101: Forecasting Your Sales with Follow Up Boss Reports
Follow Up Boss surfaces pipeline health through its built-in stage reports, activity dashboards, and smart lists. Pair these with AI-scored contact fields — such as Ace Score (0–100) and Ace Velocity Score — to move from descriptive reporting to predictive forecasting: you see not just where deals sit today, but which ones are genuinely likely to move forward this month.

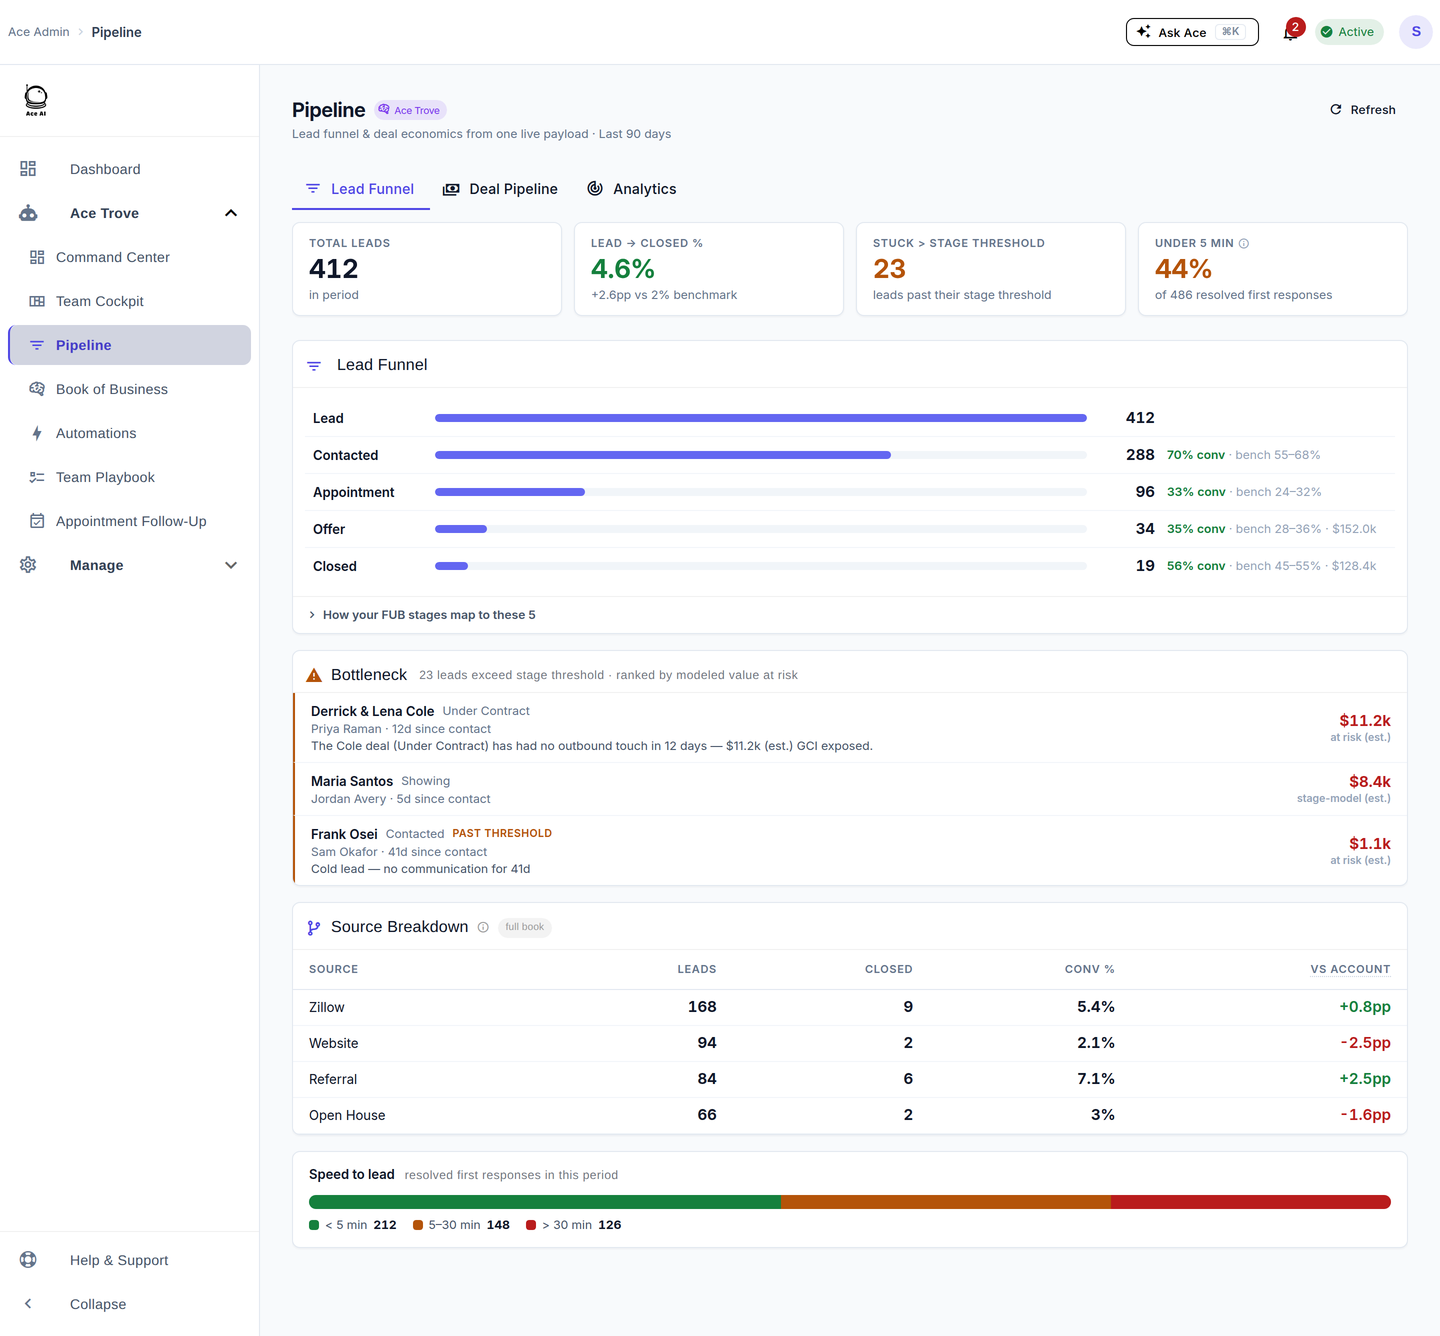
Most agents who ask "how's my pipeline?" are really asking two different questions: How many deals do I have? and Which ones will actually close? Follow Up Boss answers the first question naturally. Getting to the second — genuine sales forecasting — requires understanding which pipeline signals actually predict closings, and how to surface them without drowning in spreadsheets.
This guide walks through Follow Up Boss's native reporting tools, the metrics that matter most for forecasting, and how AI-driven scoring layers sharper prediction on top of the data you already have.
What pipeline analytics actually means for real estate agents
Pipeline analytics in a real estate context means tracking every lead from first contact through to close, measuring how long contacts spend at each stage, and identifying patterns that predict which stage-transitions actually happen. The goal is to turn your CRM history into a forward-looking forecast — not just a backward-looking count of past deals.
Unlike a typical B2B SaaS funnel with a predictable 30-day cycle, a real estate pipeline can span 3 months to 3 years. That time variance makes simple "deals in stage × average close rate" math unreliable. What matters more is engagement velocity: how actively is a lead responding, and is that engagement accelerating or stalling?
What reports does Follow Up Boss include for pipeline visibility?
Follow Up Boss offers several native reporting surfaces that together paint a picture of pipeline health. Each answers a distinct question:
| Report / View | What it answers | Best for |
|---|---|---|
| Activity Report | Calls, texts, emails logged per agent per period | Team accountability |
| Lead Source Report | Volume and stage distribution by source | Budget allocation |
| Stage / Pipeline View | How many contacts are in each deal stage | Snapshot forecasting |
| Smart Lists | Dynamic filters on any field combination | Custom segment monitoring |
| Deal / Transaction View | Closing date, price, agent attribution | Revenue projection |
The Transactions view is the closest FUB gets to a true revenue forecast out of the box: filter by expected close date, sum deal values, and you have a rough 90-day projection. The limitation is that deal stages are manually updated — if agents don't keep them current, the numbers drift from reality.
How do you build a meaningful sales forecast from FUB data?
A reliable forecast combines stage position with engagement quality. Here is a repeatable process:
- Define your stage conversion rates. Pull 6–12 months of closed deals. For each stage (e.g., "Active Buyer" → "Under Contract"), count how many contacts that entered the stage eventually closed. These are your baseline conversion rates — the denominator of your forecast.
- Weight by time-in-stage. A contact who has been in "Active Buyer" for 14 days is statistically more likely to advance than one who has been there 180 days. Create a smart list filtered by stage + last-activity date to separate fresh vs. stale contacts.
- Add an engagement quality signal. Stage position alone misses the crucial question of whether a lead is actually engaged. This is where behavioral scores — like the Ace Velocity Score, which tracks whether a contact's inbound engagement is accelerating or decelerating — add forecasting precision beyond what deal stages show.
- Apply to transactions. In the Transactions view, add projected close dates and expected values. Sum by month for a 90-day revenue projection. Review weekly — deals shift quickly.
- Build a "deals at risk" smart list. Filter: stage = active buyer or under contract + last activity older than 14 days. These are the stalls that most often kill forecast accuracy. Review every Monday.
Which metrics are most predictive of whether a lead actually closes?
Not all pipeline metrics predict closing equally well. Based on how real estate CRM engagement data behaves, the signals with the highest predictive weight are:
- Response rate and recency. Leads who reply to messages within hours are far more likely to transact than leads who go days without responding. Ace Response Time — one of the seven AI-scored contact fields written back to Follow Up Boss — tracks exactly this pattern.
- Inbound vs. outbound ratio. When a lead starts initiating contact (calls you, replies unprompted), that shift from passive to active is one of the clearest pre-close signals in the data.
- Engagement velocity trend. Is engagement accelerating week over week, or has it plateaued? The Ace Velocity Score (0–100 scale) captures this trend, giving you a single number to sort on rather than manually comparing activity logs.
- Days since last inbound. Forecasts built only on outbound activity overstate pipeline health. Ace Days Since Inbound corrects for this by measuring how recently the lead actually reached out to you.
- Stage dwell time vs. cohort average. If contacts normally spend 21 days in "Showing Homes" before going under contract, a contact at day 45 is a warning sign worth flagging.
All seven Ace fields — Ace Score, Ace Tier, Ace Status, Ace Response Time, Ace Velocity Score, Ace Days Since Inbound, and Ace Preferred Channel — are written back as custom fields in Follow Up Boss and are available on every account tier, including free. This means they show up in smart lists and reports the same way any other FUB field does, without requiring any custom integration work.
How does the pipeline-health-check tool work?
For teams using Follow Up Ace's agentic layer, there is a dedicated pipeline-health-check tool that surfaces pipeline bottlenecks on demand. Rather than pulling a static report, it analyzes your current contact distribution across stages, flags contacts with high Ace Scores but no recent activity, and summarizes where follow-up gaps are costing you velocity.
You can invoke it through the agentic chat interface with a plain-English prompt like "show me which active buyers haven't had contact in 10 days." The tool queries Follow Up Boss in real time and returns a prioritized list, so there's no exporting, no spreadsheet manipulation, and no manual cross-referencing of reports.
The companion lead-nurture-optimizer tool takes the output a step further: given a stalled contact, it suggests the next best action based on that contact's communication history, preferred channel, and current Ace Tier. See the Ace Trove overview for the full list of tools available at each plan tier.
How do you set up a weekly pipeline review routine?
A weekly pipeline review turns your FUB data from a passive record into an active management tool. A consistent 30-minute Monday routine is enough for most solo agents and small teams:
- Open the Activity Report. Confirm that every active-stage contact had at least one touchpoint in the past 7 days. Flag gaps.
- Sort your "Active Buyers" smart list by Ace Score descending. Your top-scored leads get the first call of the week. Ace Score (0–100) is recalculated nightly, so Monday's list reflects the weekend's engagement shifts.
- Review your "at risk" list. Any contact with a deal stage of Active Buyer or later and an Ace Velocity Score below 30 deserves a direct call — not an automated email — this week.
- Update the Transactions view. Move any deal that has a new estimated close date. This keeps the 90-day revenue projection accurate.
- Note one trend. Is the total number of Hot-tier contacts growing or shrinking week over week? That directional trend is often a leading indicator of revenue 60–90 days out.
Common pipeline analytics mistakes to avoid
Even agents using FUB consistently fall into a few predictable traps when reading their pipeline data:
- Counting contacts instead of measuring engagement. A pipeline with 200 active leads and no engagement signal is not a strong pipeline — it is a large list. Focus on the subset that is actually responding.
- Over-weighting stage position. Stages are only as accurate as the last time someone updated them. Engagement metrics are updated automatically and reflect reality more accurately.
- Not separating outbound activity from inbound responses. Logging 50 calls per week is an activity metric, not a pipeline health metric. What matters is how many of those calls got a response.
- Ignoring lead source when forecasting. A Zillow lead and a past-client referral at the same pipeline stage have very different close probabilities. The Lead Source Report helps you apply different conversion weights by source type.
- Updating forecasts quarterly instead of weekly. Real estate pipelines move too fast for monthly reviews. Stale data produces forecast errors that compound quickly.
What's the difference between a pipeline report and a forecast?
A report describes the current state: how many contacts are in each stage right now, how many calls were made last week. A forecast applies probability weights to that current state and projects a future revenue number.
Most Follow Up Boss users stop at the reporting layer. The step to forecasting requires two additions: historical conversion rates per stage (which you derive from past closed deals) and an engagement quality signal that adjusts those rates for individual contacts. The Ace Score and Ace Tier fields are designed to provide exactly that adjustment — they tell you whether a given contact in "Active Buyer" is behaving more like your historical closers or more like your historical drop-offs.
If you're building more advanced projections, the Guides section covers how to combine FUB smart lists with external tools for revenue modeling, and the AI lead scoring guide goes deeper on how the scoring fields are calculated.
Try Follow Up Ace in your Follow Up Boss
Free to start, no sales call. Connect Follow Up Boss in one click and Ace works inside your CRM.
Get Started Free