The Ultimate Guide to Performance Reporting in Follow Up Boss

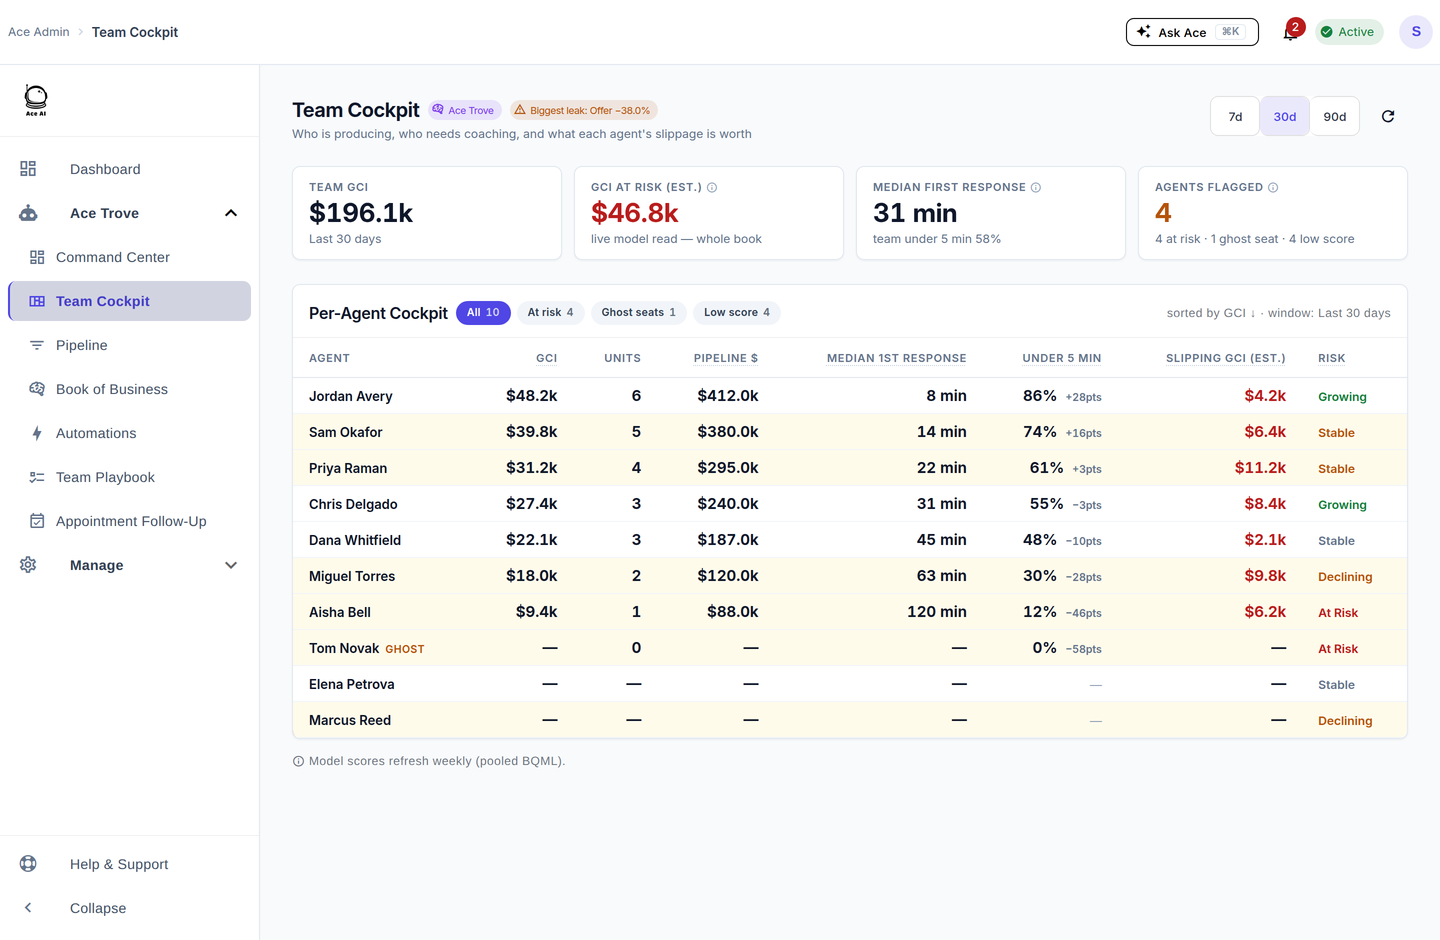
Follow Up Boss performance reporting lives under the Reports tab and covers agent activity (calls, texts, emails), first response time, lead source conversion, and pipeline stage distribution. Filter by agent, date range, and lead source. Use Smart Lists for live monitoring, CSV export for custom analysis, and the FUB API for deeper integrations. Pair with Follow Up Ace to add AI-scored lead data to every report.
What reports does Follow Up Boss include natively?
Follow Up Boss ships with a dedicated Reports section accessible to account admins and team leaders. The built-in reports fall into four categories:
- Activity Reports — Calls made, texts sent, emails logged, and notes created per agent over a chosen date range. This is your ground-level activity audit.
- Response Time Reports — Median and average minutes to first contact after a lead is created, per agent. Arguably the most important performance metric in real estate lead conversion.
- Lead Source Reports — Incoming lead volume and status distribution by source (Zillow, website, referral, etc.). Tells you where to invest your lead generation budget.
- Pipeline Reports — Count and value of deals in each pipeline stage at the time of the report. Use this to forecast closings and spot stalls.
Each report supports date-range filtering, agent filtering, and CSV export. There is no scheduled-email delivery built into FUB — but you can export manually or use the API to push data to a BI tool automatically.
How do you read the Activity Report?
The Activity Report answers: "Who on my team is doing the work?" Each row is an agent. Columns show:
- Total calls (outbound and inbound combined)
- Total texts sent
- Total emails sent
- Total notes created
Sort by calls to see who is dialing most. Sort by emails to spot agents who are hiding behind written communication when the lead calls for a phone conversation. Activity volume is a leading indicator — it predicts conversion several weeks before pipeline numbers reflect it.
What is a healthy call volume benchmark for a real estate agent?
This depends entirely on your team's role and lead type. A high-volume Zillow buyer team might target 50+ outbound dials per agent per week; a referral-only team working fewer, warmer leads might target 15–20 meaningful conversations. Set your own baseline from your top performer and coach others toward it — do not apply industry averages to your specific team structure.
How do you use the Response Time report for coaching?
Response time is the metric with the clearest link to conversion in real estate CRM data. A contact reached within the first few minutes of inquiry is dramatically more likely to have a conversation than one reached hours later. The FUB Response Time report shows this per agent.
Use it this way:
- Pull the report for the last 30 days, all agents.
- Sort by median first response time, ascending (fastest first).
- Identify agents in the bottom quartile — not just the worst, but anyone above your team target (e.g., 10 minutes).
- Cross-reference with their Activity Report: agents with low response time AND high call volume are your top performers. Agents with high response time AND low calls need coaching on workflow, not just motivation.
What are Lead Source Reports used for?
The Lead Source Report shows how many leads arrived from each source and what status those leads are currently in. It answers: "Which sources produce closeable leads, not just clicks?"
A lead source that delivers a lot of new contacts but where most remain in "New" status six months later is producing volume without value. A lead source that delivers fewer contacts but where a meaningful proportion have reached "Active Client" or "Closed" is worth scaling.
Check this report quarterly, not weekly — lead-to-close cycles in real estate are long, and weekly snapshots are too short to judge source quality.
How do Pipeline Reports help with forecasting?
The Pipeline Report shows your current deal inventory by stage: how many deals are in each stage right now, and the aggregate dollar value if you capture all of them. It does not show historical conversion rates from stage to stage (that requires a BI tool or the API), but it gives you a current health check.
Use the pipeline report to:
- Spot stages with a growing backlog (leads piling up without progressing — a process problem)
- Identify agents with thin pipelines who need lead reassignment
- Estimate near-term closed volume for team capacity planning
What are Smart Lists and how do they function as live reports?
Smart Lists are saved, filtered views of your People database that update live as data changes. Where the Reports tab shows aggregate counts over time, Smart Lists show you the exact contacts that match a condition right now.
High-value Smart Lists for performance monitoring:
- Hot Leads — No Call Logged Today (status = Hot, no call in last 24h) — live priority queue every morning
- New Leads — No Contact in 60 Minutes — real-time speed-to-lead alert
- Active Buyers — Stalled 14+ Days — pipeline health check
- Closed This Month — running total of wins
Share these lists across your team so everyone sees the same priority view. Pin them in the FUB sidebar so they are the first thing agents open each morning.
How do you export Follow Up Boss reports and use them in Excel or Google Sheets?
Every FUB report has a CSV export button. For ongoing analysis:
- Export the Activity Report weekly to a shared Google Sheet.
- Use a VLOOKUP or pivot table to compare agent activity week-over-week.
- Create a chart that tracks median response time by agent over the past 12 weeks — this surfaces improvement trends that the single-week view misses.
For automated exports, use the FUB API (GET /v1/events with a date filter) to pull activity data on a schedule. See our API query parameters guide for the exact parameters to use.
How does Follow Up Ace make FUB reporting more actionable?
Native FUB reporting shows activity and pipeline snapshots. Follow Up Ace adds a predictive, AI-driven layer that makes those numbers actionable.
Ace writes seven model-grounded custom fields to every contact — Win Score and Churn Risk free, five more with Ace Trove — which become available as filter criteria in any FUB report or Smart List:
| Ace Field | What it adds to reporting |
|---|---|
| Ace Win Score (0–100, free) | Sort pipeline by calibrated win probability, not just stage |
| Ace Churn Risk (Low/Medium/High, free) | Segment the save-list — engaged contacts about to go cold |
| Ace Expected GCI (est., Ace Trove) | Rank follow-up by estimated commission at stake |
| Ace Opportunity (Ace Trove) | Filter by recommended play — At Risk / Active Buyer / Active Seller / Likely Seller / Nurture |
| Ace Seller Tier (Ace Trove) | Surface likely listings hiding in the database |
| Ace Buyer Tier (Ace Trove) | Rank who is most likely to buy in the next ~6 months, a relative ranking and not a guarantee |
| Ace Last Analyzed (Ace Trove) | Freshness stamp for every AI value |
With these fields in place, a Smart List like "Hot Score > 70, Ace Status = Contacted, No activity in 5 days" becomes a surgical priority list — contacts who are engaged and have been touched at least once, but risk going cold. That is a list an agent can work through in 90 minutes and is categorically more useful than a generic "all active leads" view.
For teams that want deeper BI: the Ace Trove tier adds data warehouse access, lead funnel velocity metrics, and per-account pipeline benchmarking. See the pipeline analytics guide for a walkthrough.
What is the right cadence for reviewing FUB performance reports?
| Frequency | What to review | Action |
|---|---|---|
| Daily | Hot Leads — No Contact Smart List | Assign or follow up before leads go cold |
| Weekly | Activity Report + Response Time | Coach below-baseline agents; recognize top performers |
| Monthly | Pipeline Report + Lead Source Report | Adjust pipeline focus; reallocate marketing budget |
| Quarterly | Lead source conversion (long-cycle view) | Cut underperforming sources; double down on what works |
Also see the FUB KPI checklist for a full list of metrics to track at each cadence, and our team performance reports setup guide for a step-by-step walkthrough of the Reports tab.
Try Follow Up Ace in your Follow Up Boss
Free to start, no sales call. Connect Follow Up Boss in one click and Ace works inside your CRM.
Get Started Free