How to Use Follow Up Boss for Team Performance Reports

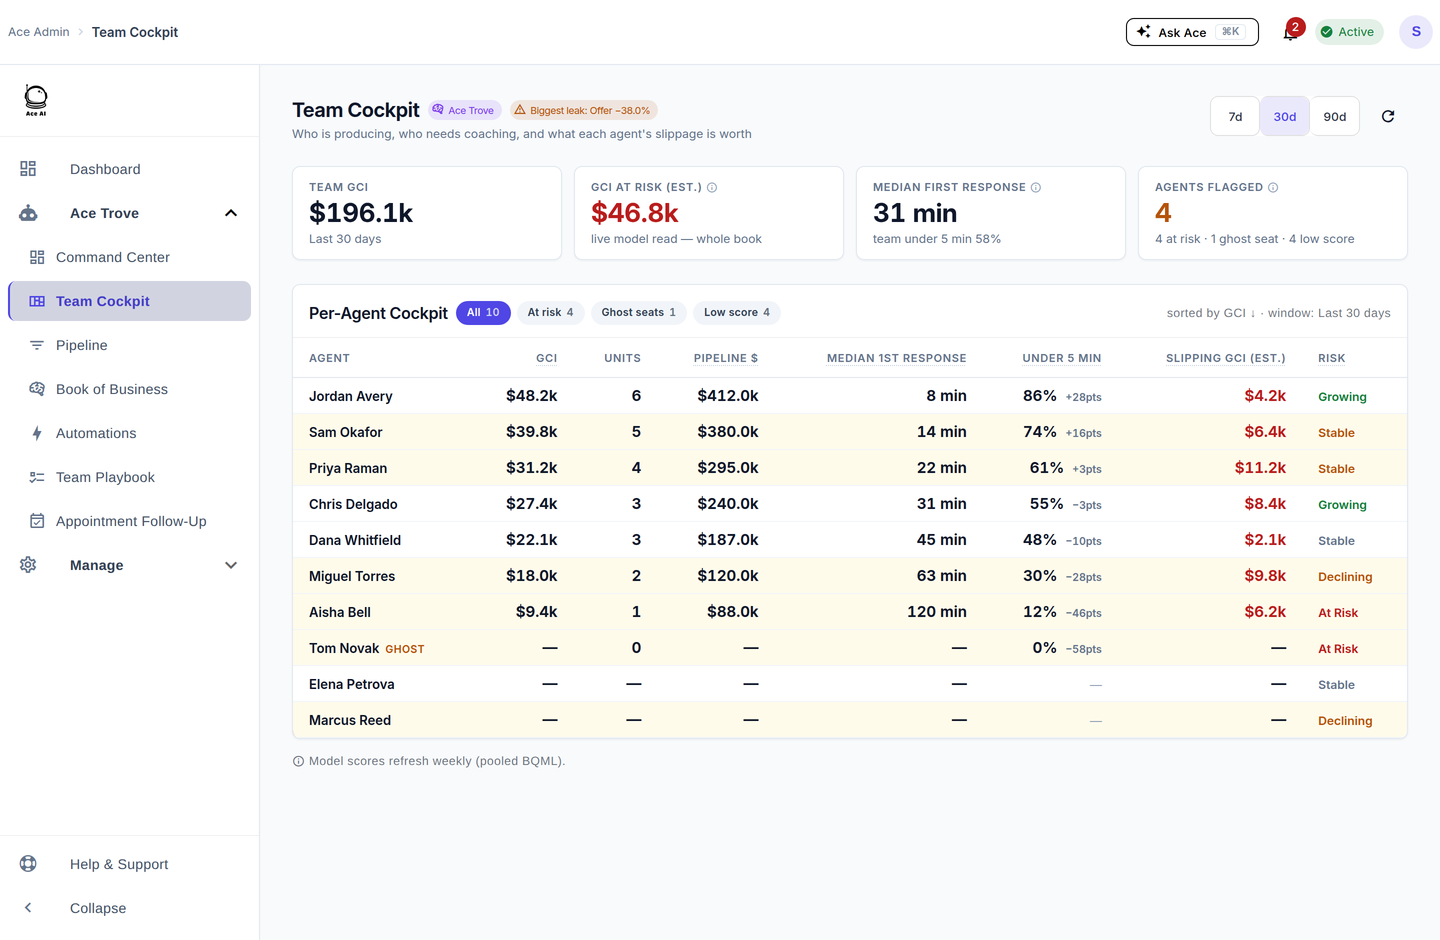
Follow Up Boss includes a built-in Reporting tab that tracks agent activity (calls, texts, emails), response times, pipeline stage distribution, and deal velocity. Filter by agent, date range, lead source, and stage. Use Smart Lists for live segmented views you can share with the team. For AI-driven scoring on top of native reports, pair FUB with Follow Up Ace.
What reporting does Follow Up Boss include out of the box?
Follow Up Boss has a dedicated Reporting section accessible to admins and team leaders. It covers four main areas:
- Activity Reports — Call volume, text count, email count, and notes logged per agent for a selected date range
- Response Time Reports — How quickly each agent first contacts a new lead
- Lead Source Reports — Where leads are coming from (Zillow, website, referral, etc.) and how each source converts
- Pipeline Reports — Current deal count, deal value, and distribution across stages
All reports can be filtered by agent, date range, and lead source. Data can be exported to CSV for further analysis in Excel or Google Sheets.
How do you set up team performance tracking in Follow Up Boss?
- Verify call logging is connected. FUB's built-in calling and texting logs activities automatically. If your team uses a third-party dialer (like FUB Calling or a connected softphone), confirm the integration is active in Admin → Integrations so calls flow into the activity feed.
- Open the Reporting tab. Navigate to Reports in the left sidebar. The default view shows the current week; use the date picker to choose your reporting period.
- Filter by agent. Use the "Assigned To" dropdown to isolate one agent's numbers or compare all agents side by side.
- Check response time. The First Response report shows median and average time-to-first-contact for each agent. This is the single metric most correlated with lead conversion — industry research (National Association of Realtors and others) consistently finds leads contacted within five minutes are dramatically more likely to engage.
- Export or schedule. Export raw data to CSV from any report view. For regular distribution, build a recurring export routine or use the FUB API (
GET /v1/eventswith a date filter) to push data into a shared dashboard.
What are Smart Lists and how do they help with team performance monitoring?
Smart Lists are saved filtered views of your contact database. They update live as data changes. For performance management, create Smart Lists like:
- "Hot Leads — Uncontacted" (stage = New Lead, no call logged in last 24 hours) — surfaces leads at risk of going cold
- "Active Buyers — No Contact in 7 Days" (stage = Active Buyer, last contact more than 7 days ago) — flags neglected pipeline
- "Leads Assigned to [Agent] This Month" — per-agent new lead count
Admins can share Smart Lists with the full team so agents see the same curated views as their manager during weekly check-ins.
What KPIs should teams track in Follow Up Boss?
| KPI | Where to find it in FUB | Why it matters |
|---|---|---|
| First response time | Reports → Response Time | Speed to lead is the top conversion driver |
| Calls per agent per week | Reports → Activity | Indicates consistent follow-up effort |
| Lead source conversion | Reports → Lead Source | Tells you where to invest marketing budget |
| Pipeline stage distribution | Reports → Pipeline | Flags stalled deals before they go cold |
| Dormant contacts | Smart List (no activity > 30 days) | Revenue hiding in the database |
How does Follow Up Ace add AI-driven intelligence on top of FUB reports?
Native FUB reporting shows you what happened — activity counts, response times, pipeline snapshots. Follow Up Ace adds a predictive layer that tells you what is likely to happen next.
Ace writes two free predictive custom fields into every contact's FUB record automatically:
- Ace Win Score (0–100) — A within-account percentile rank, not a close probability. Use it to sort relative modeled priority; score delivery follows the account cadence, and webhook receipt alone does not prove a field write.
- Ace Churn Risk (Low / Medium / High) — The model's risk that an engaged contact goes cold — a one-glance save-list filter
Engagement velocity, response time, days since inbound, and preferred channel are still tracked on every webhook — they feed the models and the ranked queue rather than occupying field slots.
Because these fields live inside FUB as native custom fields, they appear in your existing reports and Smart Lists. A Smart List of "Win Score > 75 leads uncontacted today" becomes a one-click morning priority queue for every agent.
The Ace Trove tier adds the deeper fields: Expected GCI (est. — win probability × your account's real median commission), Opportunity (the recommended play per contact), Seller Tier, and Last Analyzed. See the Agentic page for how the 189-tool MCP surface lets you query your team's pipeline in natural language.
How do you run a weekly team performance review using FUB data?
- Pull the Activity Report for the past 7 days, filtered to all agents, sorted by calls descending.
- Open the Response Time report for the same period — flag any agent with a median first response above 60 minutes.
- Check your "Hot Leads — No Contact in 48 Hours" Smart List. Any contact on this list is a concrete follow-up task to assign in the meeting.
- Pull the Pipeline report and compare stage distribution week-over-week — declining numbers in "Active Buyer" with stable "New Lead" counts means leads are not progressing, which is a coaching signal.
- If you have Ace installed: filter your Ace Win Score field for contacts scored above 70 that have not had an agent contact in the last 5 days — or simply filter Ace Churn Risk = High — these are valuable leads slipping toward cold.
For a deeper look at pipeline metrics, see our pipeline analytics guide and the FUB KPI checklist.
Try Follow Up Ace in your Follow Up Boss
Free to start, no sales call. Connect Follow Up Boss in one click and Ace works inside your CRM.
Get Started Free