1Introduction
Most “AI-powered” lead scoring ships as a black box: a confident number, no evidence, no way to check it. We think that’s backwards.
Agents and team leads make real money decisions on these scores — who to call first, which deal to save, where the next listing is likely hiding. A score that drives money decisions should be held to the same standard as any other business number: show your work. This report is that work, in plain language.
It covers the six serving families plus the full-book fallback fit (Section 2), held-out methodology (Section 3), the dated results (Section 4), internal probability calibration and the published rank transformation (Section 5), thin-history coverage (Section 6), and the limits we publish on purpose (Section 7).
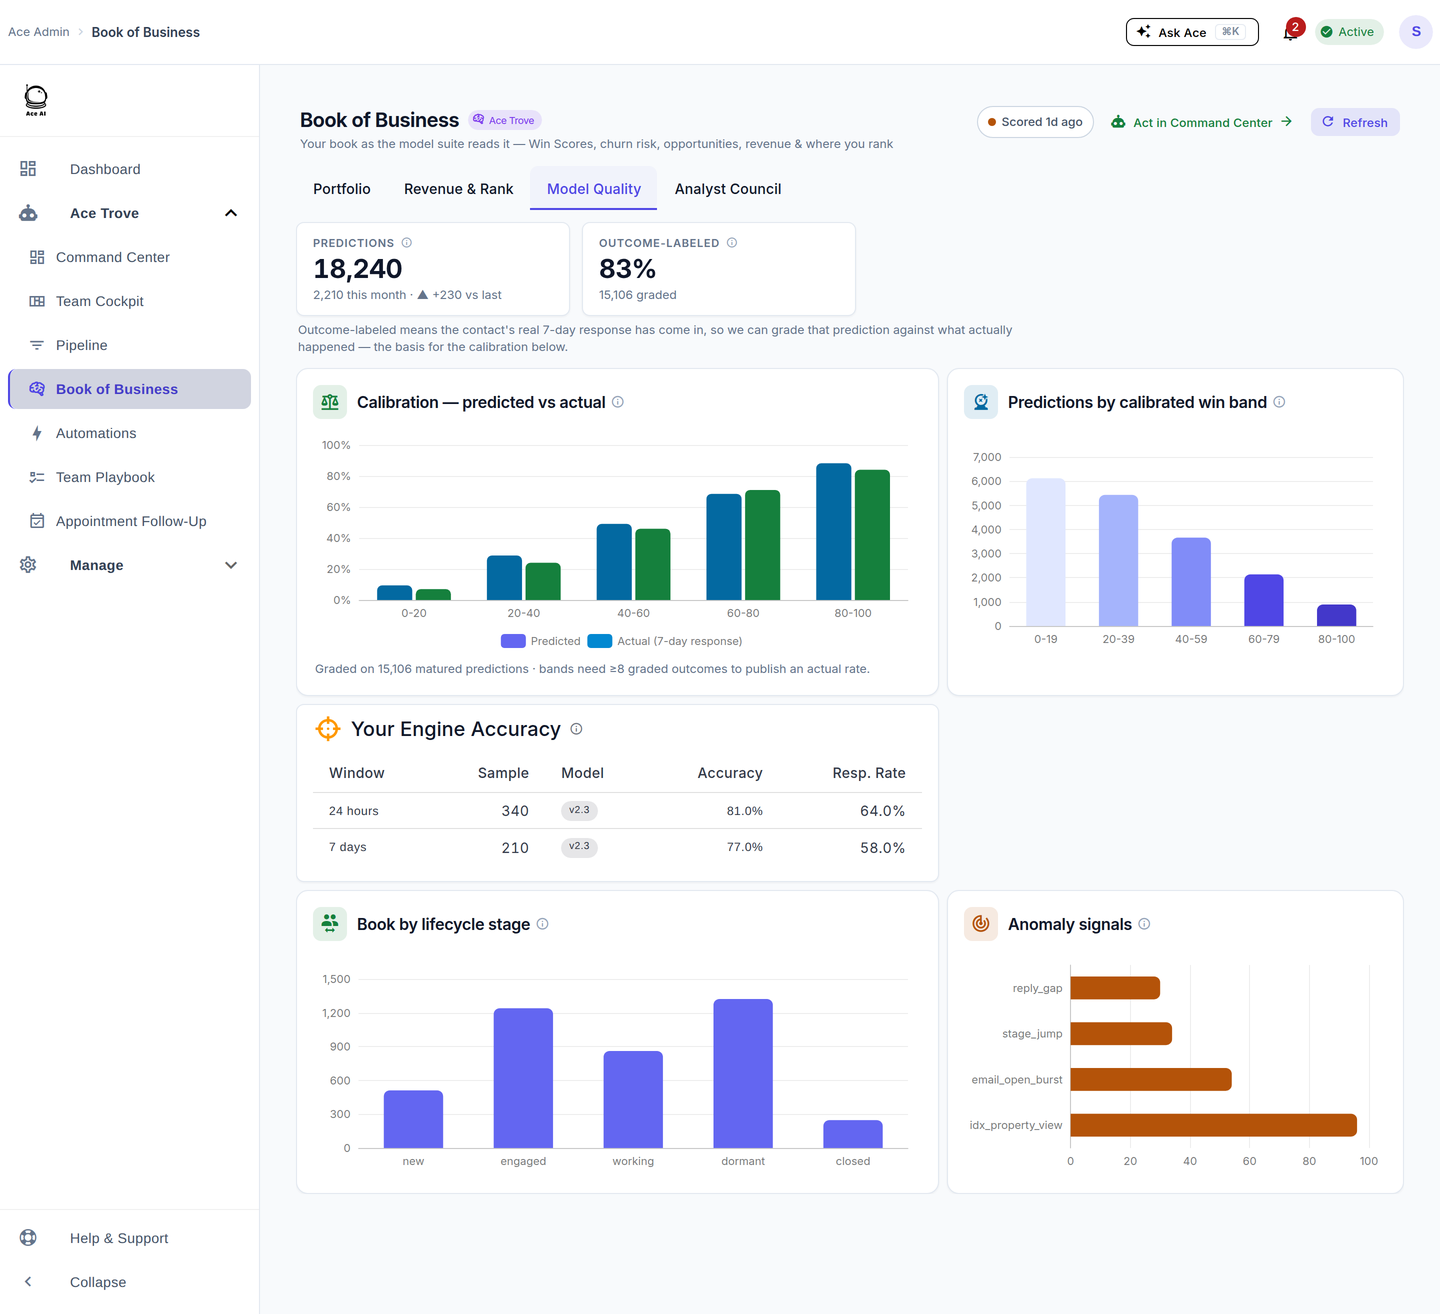
The same discipline runs inside the product. Trove’s Book of Business includes a Model Quality view that grades our own predictions on your account: how many predictions have been checked against real outcomes, and how predicted probabilities compared to what actually happened. A number you can audit is worth more than a bigger number you can’t. That is the whole philosophy.
2The seven models
Trove has six serving model families plus a seventh deployed fit: the full-book fallback answers the same conversion question on a broader, thinner-history population. Models are evaluated on labeled outcomes from CRM activity.
| Model | The question it answers |
|---|---|
| Win (conversion) | Relative modeled conversion evidence, ranked within the account to publish Ace Win Score; the published score is not a close probability. |
| Response | Will this contact respond to outreach? Helps order the daily queue and time reach-outs. |
| Churn risk | Will this engaged contact go cold? Powers the Ace Churn Risk read and save-lists. |
| Appointment propensity | Will this contact book an appointment? The mid-funnel signal — who is likely to get on a calendar. |
| Full-book fallback (conversion) | A conversion read for the widest slice of the book — including contacts with very thin history the headline models can’t score confidently. |
| Buyer-track propensity | Is this contact likely to close on the buy side within 180 days? New August 2026 — powers the Ace Buyer Tier read. |
| Seller-track propensity | Is this contact likely to close on the sell side within 180 days? New August 2026 — blends into the Ace Seller Tier alongside the property/behavioral seller-intent score. |
All seven fits use strict as-of discipline: a training example may only see information available before its outcome cutoff. The scheduler evaluates model age and drift, retrains when due, and only promotes a candidate that passes guardrails. Every connected eligible account is scheduled nightly for Ace Win Score and Ace Churn Risk, whether free or on a paid seat. Those configured cadences are not proof that the latest production run succeeded.
3Evaluation methodology
Every number in Section 4 is a held-out evaluation. That phrase carries the entire weight of whether these figures mean anything, so it is worth spelling out.
- A slice of history is set aside before training. The model never sees it — not during training, not for tuning.
- The model predicts on that slice. For each held-out contact it produces a probability, blind to what actually happened.
- Predictions are compared to recorded reality. The held-out examples have known outcomes — the contact converted or didn’t, responded or didn’t, went cold or didn’t — so the comparison is against facts, not assumptions.
Because the model never saw those examples, held-out results measure genuine predictive skill rather than memorization. A model can ace its own training data and be useless in the wild; held-out evaluation is how you catch that before your agents do.
Why leakage is the silent killer of vendor metrics
The most impressive AI numbers in this industry are often the least trustworthy, and the reason is almost always leakage: the model was accidentally allowed to see a scrap of the future when it made its “prediction.” Imagine training a model to predict whether a deal closes, and one of the columns it learns from is the date the deal closed. It will look nearly perfect in testing and fall apart in production, because in production that column is empty at the moment you need the prediction.
Leakage is what lets a vendor honestly report a spectacular figure that their product can never reproduce for you. Guarding against it is unglamorous and it is the whole game. Our defense is the time rule from Section 2 — an example may only learn from information that existed before its outcome was known — enforced at training time, plus held-out slices that a model has genuinely never touched. A figure earned this way is lower than a leaky one and it is the only kind worth publishing.
The loop, not the lab result
Just as important: this is not a one-time lab number. Evaluation, outcome labeling, drift checks, and guarded promotion form a recurring loop; retraining occurs when the scheduler says it is due.
Three parts of that loop deserve a sentence each:
- The champion/challenger guard. A retrained candidate does not ship just because it is newer. It has to evaluate at least as well as the model currently deployed, or the incumbent stays. A candidate that quietly regressed never reaches your account.
- Continuous outcome labeling. Live predictions are compared to what actually happened as it happens — did the contact respond or book within 24 hours? Within 7 days? Did they go cold? — with closed-deal results feeding a longer-horizon track. Those labels are what the next retrain and the next recalibration learn from.
- Per-account calibration verification. The loop is not just internal. The Model Quality view inside Trove runs the predicted-versus-actual comparison on your own account’s predictions, so the claim in Section 5 is checkable on your data, not just ours.
Figure 2 is the part of the loop most vendors skip: every prediction is kept and later checked against the outcome it claimed.

4Results: held-out AUC
The standard measure for models like these is AUC — area under the ROC curve. Table 1 gives the held-out AUC from the most recent evaluation of each of the seven production models — August 13, 2026 for Win, Response, Churn Risk, and the full-book fallback; August 12, 2026 for the two propensity models; July 2, 2026 (unchanged since) for Appointment — with a plain reading of what each figure means for the work.
| Model | Held-out AUC | What this means operationally |
|---|---|---|
| Churn risk | 0.9662 | The strongest ranker in the suite. Separates engaged contacts about to go quiet from those who will stay warm, so save-lists target the right people before they cool. |
| Win (conversion) | 0.9449 | Sorts the book so eventual closers sit near the top — a call-from-the-top list is dense with real deals. Headline model behind the Ace Win Score. |
| Response | 0.9440 | Orders who will reply, so outreach and the daily queue lead with the contacts most likely to answer today. |
| Appointment propensity | 0.8890 | Flags who is close to getting on a calendar — the mid-funnel nudge between “replied” and “under contract.” |
| Seller-track propensity | 0.8232 | Ranks who is likely to close on the sell side in the next 180 days (0.7744 on the harder no-open-deal slice). New August 2026; feeds the Ace Seller Tier blend. |
| Buyer-track propensity | 0.8221 | Ranks who is likely to close on the buy side in the next 180 days (0.7876 on the harder no-open-deal slice). New August 2026; powers the Ace Buyer Tier field. |
| Full-book fallback (conversion) | 0.7259 | Covers the thin-history slice the headline models can’t score, ranking close to three of four pairs correctly where the alternative is no read at all (see Section 6). |
Table 1. Held-out AUC by model, most recent evaluation per model (see dates above). 0.50 is coin-flip ranking; 1.00 is a perfect ranking. The two propensity models are also reported on a harder no-open-deal slice, described in the table.
How to read an AUC: the ROC walkthrough
AUC answers one specific question — how well does the model rank? Here is the whole idea in one sentence you can hold onto:
Pick a random contact who actually converted and a random contact who didn’t. The Win model ranks the converter higher than the non-converter 94.5% of the time — that is exactly what an AUC of 0.9449 means.
A coin flip scores 0.5 — no ranking skill at all. A perfect ranker scores 1.0. Every figure in Table 1 is this same head-to-head win rate, computed across every convert / non-convert pair in the held-out data. It is a measure of order, and order is what a prioritized call list is made of.
What AUC is not — read this before quoting a number
An AUC of 0.9449 does not mean the model is “94.5% accurate.” AUC says nothing about the percentage of predictions that are “correct.” It measures ranking quality — whether the model puts likelier converters ahead of less likely ones — not the share of individual calls it gets right.
We deliberately avoid quoting “accuracy” at all, because for rare outcomes it is a broken metric. In a book where 1% of contacts convert, a useless model that predicts “won’t convert” for everyone is 99% “accurate” and helps you with nothing. Ranking quality (AUC) and calibration (Section 5) are the honest measures for this job.
One more caveat you should hear from us: AUC depends on the population you evaluate on. A book with many clearly-inactive contacts is easier to rank than a set of look-alike warm leads, so the same model can post different AUCs on different slices of data (Section 7 puts a number on this). Read Table 1 as ranking skill on our held-out evaluation data — a dated, checkable snapshot — not a universal grade that applies identically everywhere.
5Calibration and the published rank
AUC measures ordering. Calibration is a separate property of an internal probability: whether predicted probability bands line up with observed outcome rates. Ace can use a calibrated absolute conversion probability for Expected GCI (est.) when the calibration basis supports it.
The published Ace Win Score is not that probability. It is the contact’s 0–100 percentile rank of calibrated win likelihood within the account. A Win Score of 30 means roughly the 30th percentile of the scored book, not a 30% close probability. That transformation makes the field an honest sort key across each account without presenting a corpus-conditional model output as an absolute promise.
The reliability curve, in concept
The standard way to see calibration is a reliability curve: group predictions into bands, and for each band plot the average predicted probability against the rate the outcome actually occurred. A perfectly calibrated model lands on the diagonal — predicted equals observed. Figure 4 shows the shape you are looking for.
The practical consequence is deliberately narrower: sort Win Score descending to prioritize relative likelihood within an account. Do not read the numeric distance between two ranks as a probability ratio. Model Quality can still compare the internal probability bands with observed outcomes, while the FUB field remains a rank.
6Coverage tiers: why we publish a 0.7259 model
The number in Table 1 that tells you the most about how we operate isn’t the 0.9662. It’s the 0.7259.
The strongest models do their best work where there is engagement history to read — calls, texts, replies, appointments. But a big share of any real database is thin: old imports, leads that never engaged, contacts with barely any recorded activity. A model tuned for rich signal cannot score those contacts confidently, and there are two dishonest ways to handle that: leave the slice silently unscored, or pretend the strong models cover it. We do neither.
Instead, contacts are scored in coverage tiers. A contact with enough history is read by the headline models. A contact too thin for a confident headline read falls to a full-book fallback conversion model, built to cover the widest possible slice of the book with the thinnest available signal — so the whole database gets a read, not just the flattering part of it.
The fallback’s held-out AUC is 0.7259. That is meaningfully below the headline models — and still far better than chance: a coin flip is 0.5, and 0.7259 means the fallback puts the eventual converter ahead of a random non-converter close to three times out of four. For a portion of your database that would otherwise have no model read at all, that is a genuinely useful ranking. When a contact accumulates richer history, the stronger models take over. (This model was rebuilt August 13, 2026 on a corrected, contact-level corpus after an unrelated data defect had degraded an earlier generation — see the notice near the top of this report.)
We publish the lower number on purpose. Widest coverage, thinnest signal, honestly labeled. A vendor that only shows you its best number is telling you something about all its numbers.
7Limitations
A report that only lists strengths is marketing. Here is what these models cannot do, stated as plainly as the results.
They rank and estimate. They don’t guarantee. A contact ranked 80th percentile can still fail to convert, and a low-ranked contact can still close. Win Score allocates attention across a book; it is not a verdict or an absolute probability for one person.
Population dependence is real, and here is the size of it. Because AUC depends on the evaluation population (Section 4), the same win model that posts 0.9449 on our held-out slice can rank lower on a harder, look-alike slice of warm leads where every contact already looks promising — the two propensity models make this explicit by publishing a second, harder no-open-deal figure alongside the headline number (Table 1). Both are honest; they are simply different questions. Treat the headline figures as ranking skill on the stated evaluation data, and expect your own account’s numbers — visible in Model Quality — to sit somewhere in that range depending on how your book is composed.
They measure behavior, not intent. The models learn largely from engagement behavior, a strong but imperfect proxy. The serious buyer who never replies to anything will score low. Use the scores to decide where your personal attention goes first, not as an exclusion filter that writes people off.
Rare outcomes are hard, and honesty about them is the point. Conversion is uncommon in most books, which is exactly why we report ranking and calibration rather than “accuracy,” and why the fallback tier exists rather than a single number stretched over everyone.
Markets shift, so a snapshot is a snapshot. The scheduler evaluates model age and drift, retrains when due, and re-fits calibration as outcomes mature. The figures here are dated per model in Table 1; current operational freshness must be checked separately.
Modeled dollars are always labeled “(est.).” Anywhere a probability is turned into money — expected commission, dollars at risk, weighted forecasts — the figure is computed, not observed, and carries an “(est.)” label everywhere it appears. If we calculated it rather than counted it, we say so.
Scope note. The Seller Radar 0–100 seller-intent score is a transparent weighted-signal score whose honesty mechanism is showing you the evidence behind every score; that blended output is not itself one of the AUCs in this report. Since August 2026 the seller-track propensity model measured here is one input to that blend, alongside property and behavioral evidence — see the FAQ for the exact relationship.
8Frequently asked questions
Q.Does a 0.9449 AUC mean the model is 94.5% accurate?
No. AUC is not accuracy. It means that when you pick one contact who converted and one who didn’t, the model ranks the converter higher about 94.5% of the time. It says nothing about the share of individual predictions that are “correct” — and for rare outcomes, “accuracy” is a misleading metric anyway, which is why we report ranking quality and calibration instead.
Q.What is a held-out evaluation, and why does it matter?
A slice of labeled history is set aside before training and never shown to the model. The model then predicts on that slice, and its predictions are compared to the real recorded outcomes. Because the model never saw those examples, the result measures genuine predictive skill rather than memorization — and it is the discipline that prevents leakage, where a model is accidentally allowed to see the future and posts a number it can’t reproduce in production.
Q.How often are the models re-evaluated?
The scheduler evaluates age and drift, retrains when due, and promotes only candidates that pass held-out guardrails. Outcome labels and calibration update as results mature. Every connected eligible account is scheduled nightly for Ace Win Score and Ace Churn Risk, whether free or on a paid seat. Current success still has to be verified in health status.
Q.How does calibration relate to Ace Win Score?
Calibration applies to an internal conversion probability. Published Win Score is the within-account percentile rank of calibrated likelihood, so 30 means roughly the 30th percentile, not a 30% close probability. Expected GCI (est.) uses an internal absolute probability only when supported.
Q.Why publish a 0.7259 model next to ones above 0.90?
Because a real database has a large slice of thin-history contacts the strongest models can’t score confidently. Rather than leave them unscored, a full-book fallback covers that slice with the thinnest available signal. Its 0.7259 is well below the headline models and still meaningfully better than a coin flip — it ranks the eventual converter first close to three times in four, for contacts that would otherwise get no read at all.
Q.Do these AUC figures apply to the Seller Radar score?
Mostly no, with one nuance. The Seller Radar 0–100 seller-intent score is a transparent weighted-signal score built from property and behavioral evidence, and that blended output is not itself one of the AUCs in this report. Since August 2026, one input to that blend is the seller-track propensity model measured here (held-out AUC 0.8232) — it contributes as evidence, not as a replacement for the underlying signals. The buyer-track propensity model (AUC 0.8221) is the same kind of component, feeding the Ace Buyer Tier field. Neither model’s raw 0–100 score is itself published to Follow Up Boss — only the resulting tier.
Q.What are the two new buyer/seller propensity models?
Added to production August 12, 2026, they answer a different question than the other five: not just will this contact transact, but which side of the transaction are they likely on — buying or selling. Each predicts whether a contact closes a deal on that track within 180 days, trained only on accounts whose Follow Up Boss pipelines actually distinguish buyer- and seller-track deals. Held-out AUC is 0.8221 (buyer) and 0.8232 (seller) overall, with a second, harder figure reported for contacts with no currently-open deal (0.7876 buyer, 0.7744 seller) — both in the “excellent” to “strong” range. They power the Ace Buyer Tier field and blend into the Ace Seller Tier alongside the existing property/behavioral seller-intent score.
9Glossary
AUC (area under the ROC curve)
A measure of ranking quality from 0.5 to 1.0. It equals the probability that the model ranks a randomly chosen positive example (e.g. a converter) above a randomly chosen negative one. 0.5 is a coin flip; 1.0 is a perfect ranking. AUC is not accuracy.
Held-out evaluation
Scoring a model on data set aside before training and never shown to it. Because the model never saw those examples, the result measures real predictive skill rather than memorization — and it is the primary defense against leakage.
Leakage
When a model is accidentally allowed to learn from information that wouldn’t exist at prediction time (a scrap of the future). It inflates test numbers and collapses in production. Enforcing that examples only learn from information predating their outcome is how we prevent it.
Calibration
The property that an internal stated probability matches observed outcome rates. A model can rank well yet be poorly calibrated. Published Win Score is derived as an account-relative percentile rank, not exposed as that probability.
Outcome labeling
Retaining each prediction and later attaching what happened as the result matures. Those labels feed calibration and the next retrain when due.
Coverage tier
Which model scores a given contact, based on how much history that contact has. Rich-history contacts are read by the headline models; thin-history contacts fall to the full-book fallback so the whole database gets a read, not just the flattering part of it.
Champion / challenger guard
The promotion rule: a retrained candidate (challenger) replaces the deployed model (champion) only if it evaluates at least as well on held-out data. A candidate that quietly regressed never reaches your account.
Want the product story around these models? Read the Ace Trove launch announcement for what the suite does day to day, the predictive lead scores guide for what each field means on a contact, or the complete Ace Trove overview for the whole account-wide layer.
Scores you can audit, on your own database
Ace Win Score and Churn Risk populate free on every connected account — and Trove’s Model Quality view grades the predictions against your own outcomes.
Get Started Free →